Design for your audience: why a single Marketing analytics dashboard will never fulfil all your needs
Modern marketing cannot survive without data.
Of course, the concept of ‘accurate’ marketing measurement has taken a bashing over the last 8-9 years or so. Manufacturer initiatives such as Apple’s App Tracking Transparency Framework has made it much more difficult to attribute installs on iOS devices, whilst regulations such as the EU’s GDPR and ePrivacy mean third party data sharing is only possible with end user consent – to name just two examples.
Despite these limitations, it’s rather unthinkable that we should return to the old days when judging the impact of our marketing campaigns – and hence, their value – was a matter of time consuming surveys and complicated statistical analysis (although techniques like Media Mix Modelling (MMM) have become increasingly relevant again in the post-attribution era).
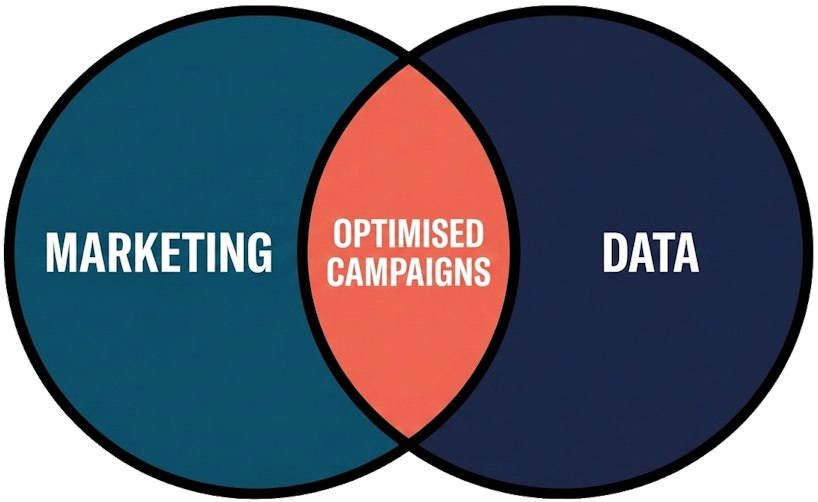
I’ll stick my neck out and say that all marketing teams have processes in place to track campaign performance & user behaviour, analyse trends, and then visualise the insights. Whilst some teams report manually using Excel or Google Sheets, many will use tools like Tableau or Metabase (my favourite) to visualise marketing data in collections of charts (dashboards) supported by the Business Intelligence team, or specialised Marketing Analysts.
Of course, how this data is presented and formatted is an important question.
Surely it’s most convenient to have all marketing data in one place; in one dashboard?
_Design for your audience__
It may seem obvious, but let’s take a step back: why do we actually need to report Marketing data?
There are 3 reasons in my recent experience:
- to help marketing managers understand the performance of their campaigns – providing data to plan new campaigns/optimise existing ones, as well as spot any issues early (the most important reason)
- to monitor the health of the user base (not their physical condition of course, but rather how your marketing is affecting their engagement with your brand, measurable through subscription rates and the like)
- to measure Marketing’s overall impact and prove it to senior management in order to unlock budgets or backup performance evaluations etc.
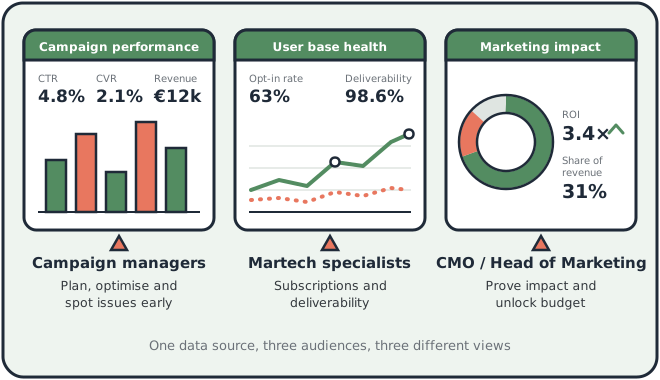
It’s important to note that the target audience for each of those reasons is distinct.
As mentioned, Marketing Campaign Managers will be most interested in the campaign performance data. User base health metrics will be primarily relevant to those responsible for subscriptions and deliverability, namely Marketing Technology Specialists. Finally, those top level performance insights are aimed at senior marketing management, namely the CMO or Head of Marketing, as well as budget holders e.g. the CFO.
Now, rolling back to question above: should Marketing data be reported in a single dashboard?
The first major lesson I learnt about marketing was ‘market for your audience’. It’s no good sending a 50% off promocode for sunglasses to customers in Berlin in November, for example. And just like your campaigns, you should design your data visualisation strategy to address your audience. That broadly means a) only including the data they need to see, and b) making sure they understand it.
One single Marketing dashboard will never be able to satisfy all stakeholders’s requirements.
_Finalising your data visualisation strategy__
When creating your data visualisation strategy, there are a few points which I have found useful to bear in mind:
- Identify ‘why’ you need to do your marketing reporting e.g. like the 3 reasons I outlined above
- Define the broad audiences who you will address with your data
- Think about the questions your audiences might ask (you can also just ask them, of course)
- Create a reporting strategy, including which dashboards you will need and the data you will show
- Set up one separate dashboard for each purpose you identified
- Avoid including unnecessary data for the target audience
- Make sure your data is understandable for your audience. Ideally your charts should be intuitive, but you might also include tooltips or write documentation
- As a matter of personal taste, I always stick to the principle of having aggregated or summarised data at the top of the dashboard and then drill down by dimension, getting more granular until displaying the raw data in table format at the bottom
Using the 3 broad objectives/audiences from above, your reporting strategy might include the following dashboards:
| 1. Campaign performance | 2. User base health metrics | 3. Executive summary | |||
|---|---|---|---|---|---|
| Purpose | Plan & optimise campaigns, spot problems | Monitor technical issues, check for bad segmentation practices | Check overall marketing performance, plan budgeting | ||
| Might include | Open and click rates, spend KPIs e.g. CPC, breakdown by campaign (& adgroup/creative if relevant) | Email deliverability KPIs e.g. bounce rates, spam reports. Email and push notification subscriptions, consents to third party data and advertising ID sharing | Top level KPIs especially related to budgets e.g. Cost per acquisition, uplift of campaigns over global control group | ||
| Target audience | Performance and CRM marketing managers | Marketing technology specialists | Senior management |
_Summing up__
As marketers, we obsess over personalization and segmentation for our customers. We should apply that same approach to our reporting. Just as you wouldn’t send a generic blast email to your entire database, you shouldn’t serve a generic, “one-size-fits-all” dashboard to your entire company. By breaking down your reporting into distinct views, you will ensure your data properly addresses your team’s and stakeholder’s needs.